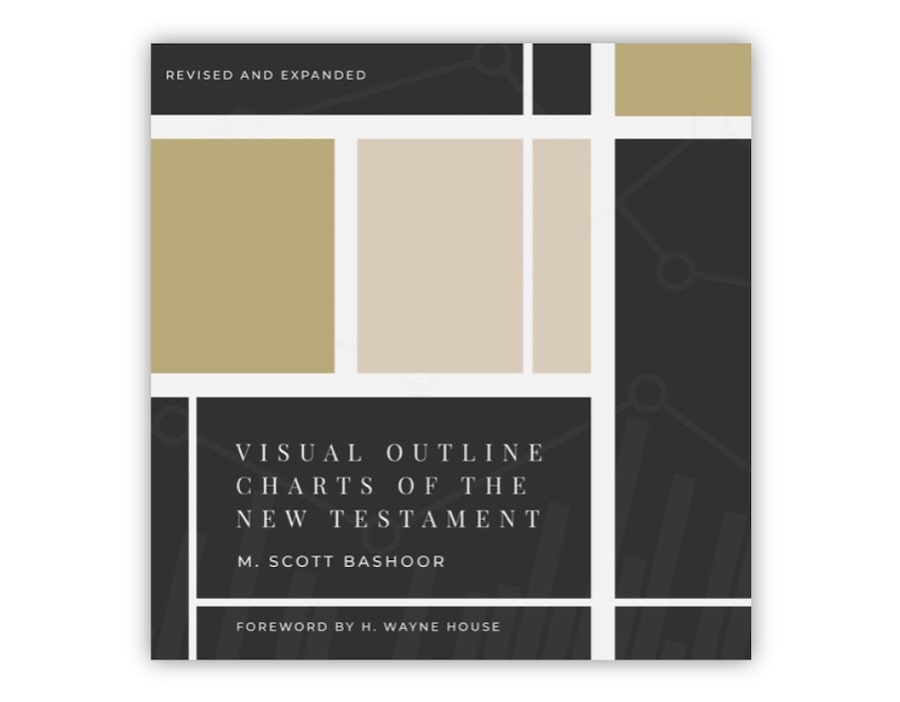
Visual Outline Charts of the New Testament
The Visual Outline Charts of the New Testament (VOCNT) help Christians grasp a "big picture" for each of the 27 books of the New Testament.

The Visual Outline Charts of the New Testament (VOCNT) was conceptualized and written by Scott Bashoor. Bashoor received two masters degrees from The Master's Seminary and currently serves as a pastor at Community Bible Church in Anaheim. Originally published in digital form only, this collection of visual charts has been updated and published by SCS Press in paperback in 2020.
Purpose of the VOCNT
The Visual Outline Charts of the New Testament (VOCNT) was created by Bashoor to help Christians grasp a "big picture" for each of the 27 books of the New Testament. It was created to be a great companion for Christians reading and studying the New Testament. The VOCNT was written for both everyday Christians and Bible students in the college and seminary level.
Content of the VOCNT
The book includes 72 visual charts.
A. Brief Introduction to Each New Testament Book
A one-page introductory text is included for each of the books of the New Testament. It is similar to what is included in the best study Bibles.
B. 27 Overview Charts of the New Testament
For each of the 27 books of the New Testament, Bashoor has produced a one page overview chart. Each overview chart is viewable on one screen. These overview charts include the following information.
- 1-3 sentence summary of the purpose of each book
- Authorship
- Date of Book
- Recipient (Original intended audience)
- Table chart summarizing the structure and content of the book.
I love the format of these overview charts. The color layout helps the reader quickly visualize the structure of each book. For example, in Ephesians, between the introduction and conclusion, two colors are used to denote the book’s two major divisions: (1) doctrinal considerations (1:15-3:21) and (2) practical implications (4:1-6:20).
Introductory material on date and authorship are consistent with conservative, traditional views. I saw no significant variance from my personal views. Here are some examples:
- Early dating of Matthew and Luke given.
- Early date of Galatians (South Galatia view) advocated.
- Pauline authorship assumed for all 13 epistles from Romans to Philemon.
- Philippians written during Paul’s imprisonment in Rome, not Caesarea or Ephesus.
- Hebrews written by an unnamed associate of the apostle Paul.
- James written by the half–brother of Jesus, and the epistle is given an early date of A.D. 45.
I have studied the discourse grammar of a few New Testament epistles. The VOCNT’s outlines are “spot on.” The table organization is innovative, and Bashoor makes effective use of alliterations. Book outline and divisions are carefully researched and based on the grammatical structure and syntax of the original text.
C. 41 Additional Focus Charts for Longer NT Books
The VOCNT provides additional charts to give more detailed focus on the four gospels and the book of Acts. The longer epistles and the Book of Revelation receive a similar treatment.
- Gospel of Matthew - 6 Focus Charts
- Gospel of Mark - 3 Focus Charts
- Gospel of Luke - 7 Focus Charts
- Gospel of John - 5 Focus Charts
- Acts - 5 Focus Charts
- Romans - 3 Focus Charts
- 1 Corinthians - 2 Focus Charts
- 2 Corinthians - 2 Focus Charts
- Hebrews - 3 Focus Charts
- Revelation - 5 Focus Charts
I find these focus charts helpful when taking a deeper dive into the longer New Testament books. For an overview or quick survey of the New Testament, the 27 overview charts are sufficient.
D. 3 Summary Visual Charts of the New Testament
The VOCNT includes three summary charts to complete the VOCNT’s set of 70 visual charts.
- The first chart organizes the 27 New Testament books by genre and provide their Greek word count based on the Nestle Aland 28th edition (NA28) Greek text.
- The second chart gives a timeline covering each NT book beginning from James (AD 45) through Revelation (AD 95).
- The final chart gives a proposed timeline for the major events of Paul and his 13 New Testament epistles.
Comparative Analysis
The VOCNT is competing in a crowded field. Many major Christian publishing companies have at least one book of Bible charts. But upon careful comparison, the VOCNT’s goals and purposes stand unique. Let me compare the VOCNT to some of the more popular visual charts.
Nelson’s Complete Book of Bible Maps and Charts
The third edition was released in 2010 by Thomas Nelson. It services as a comprehensive handbook of the Bible, and it is one of the best selling book of Bible charts available today. At 480 pages in length, Nelson’s Book of Maps and Charts is available both as a paperback and as an eBook.
However, no outlines of the books of the Bible are not presented in a visual chart. Only about one third of the book is dedicated to maps, photos and charts.
The VOCNT summarizes the introductory material using only several lines of text. It assumes more serious Bible students can look at more detailed New Testament introductions for a more thorough discussion. The book outlines takes center stage, forming the content of the visual charts.
Baker Book of Bible Charts, Maps and Time Lines
Released in 2016 by John A. Beck and published by Baker Books, this collection is available as a spiral bound paperback. About half of the book space is dedicated to stunning illustrations (Noah’s Ark, Tabernacle, Solomon’s Temp), detailed maps and time lines.
This book also contains 100 charts, but the charts organize information that do not interest me. For example, some of the charts include:
- Plants and Trees of the Bible
- Wild Animals of the Bible
- Old Testament Weapons
- Location of Jesus’ Death and Resurrection
These charts remind me of the charts seen in many of the study Bibles available today. While these charts are nice to skim through, I will not refer to these charts more than once. VOCNT’s outline charts, on the other hand, are immensely useful for continual reference as I read and study the New Testament.
Chronological and Background Charts of the New Testament
Originally written in 1978 by H. Wayne House, this collection of charts was updated in 2009 and published as a second edition by Zondervan.
There are about 140 black and white charts covering the New Testament. It is divided into four main sections.
- General Material: 18 charts covering topics like weight and measurements, NT Canon, and OT quotations.
- Background Material: 23 charts covering intertestamental history, history and government of Greece and Rome, and Jewish and Palestine culture and history.
- The Gospels: 19 charts covering the relationships of the Synoptic gospels with each other and with the fourth gospel, Christ’s life, words and teachings.
- Apostolic Age: 15 charts covering the early church, Paul’s ministry, Dating of Galatians, Authorship of Hebrews, and the interpretation of Revelation.
These charts cover introductory material of the New Testament. This book makes an excellent companion to a New Testament Introduction textbook. However, unlike the VOCNT, these charts contain no Bible outlines of the text and structure of the New Testament books.
Rose’s Book of Bible Charts, Maps and Time Lines
There are three separate volumes in this collection by Rose publishing. Each volume contain a unique collection of material. The visual presentation is spectacular. Although there is plenty of information, no tables and charts cover the content of the New Testament in outline form.
There are plenty of paperback and ebooks from Christian publishers that cover the Bible including the New Testament. However, none take the approach of the VOCNT. The Visual Outline Charts of the New Testament is a unique collection of charts that summarize the structure and content of each New Testament book with precision, accuracy, and conciseness.
Recommended Audience of the VOCNT
Having spent time with the VOCNT, I recommend the VOCNT to several target audiences.
1. Pastors and Bible Teachers
Bible teachers will likely find the visual Bible outlines very useful. If I were to teach New Testament survey in my local church, these outline charts would make a perfect visual tool.
Teaching pastors preaching through a New Testament book can refer to these overview charts to remind themselves of the big picture of the book.
2. Bible College and Seminary Students
College and seminary students who take a New Testament survey class will also benefit from the VOCNT. Even pastors preparing for an ordination exam can use the VOCNT as a great review tool.
3. Bible Readers
At least once a year, I read through the New Testament. I would love to print the VOCNT’s 27 overview charts and have them next to me as I read through each book of the New Testament.
4. Homeschooling Families
The VOCNT makes an excellent tool for classical homeschooling families. The charts can be learned and committed to memory. I cannot emphasize the soundness of the VOCNT’s content. Flashy visuals can be very distracting, but the VOCNT’s layout is clean and clear.
Final Thoughts on the VOCNT
Amidst a crowded field of visual Bible charts, the VOCNT stands alone as a collection of visual charts dedicated to presenting the introductory material and outline of each New Testament book. Scott Bashoor has succeeded admirably; I recommend this resource without reservation.
Whether you are teaching at a Bible college, your local church, or your home, the VOCNT will serve you well as an excellent teaching resource. For personal Bible reading and study, the VOCNT will enhance your ability to learn and retain the overall structure and content of the New Testament.

Visual Outline Charts of the New Testament
by M. Scott Bashoor | SCS Press (2020)


